
How to monitor your flows
A playbook that was thoroughly tested before launch can still develop problems in production that no amount of pre-launch testing would have caught: a branch that fires far more often than expected once real traffic diversity hits it, a step whose latency creeps up as an upstream provider's performance changes, a validator whose block rate quietly drifts as user behavior shifts over weeks. Monitoring is what catches these before a customer does.
This tutorial covers the observability surfaces ValGuard gives you for playbooks and agents: run-level analytics, per-step validation outcomes, request and validation logs, failing-validator trends, the agent health score league table, score-drop and rate-spike alerts, and the weekly digest that turns ranking into a ritual. By the end, you'll know:
- What playbook analytics actually measure, and how to read them
- How to use request and validation logs together to diagnose a specific failure
- How to spot a failing validator trend before it becomes a bigger problem
- How to read the Agents → Statistics league (rank, score, Δ7d) and export CSV
- How to configure health alerts (rate spikes + score drops) and the weekly league digest
- What a healthy playbook's metrics generally look like, so you can recognize when something's off
1How It Works
Playbook observability in ValGuard comes from three connected data sources, each answering a different question.
Playbook analytics (Dashboard → Playbooks, heading How your playbooks are performing, or
/api/orchestration/analytics) answers "how is this playbook behaving in aggregate?": run counts, success rate, step-level latency, and branch frequency (how often each route is actually taken relative to others). This is where you'd notice, for example, that a repair-loop branch is firing on 30% of traffic when you expected closer to 5%.Request and validation logs (Dashboard → Request logs and Dashboard → Validation logs) answer "what happened on this specific request?": every API call with status and timing in Request logs, and every individual rule evaluation with pass/fail and reason in Validation logs, filterable by agent, validator, phase (input vs. output), and, for orchestration,
step_key. This is where you diagnose a specific incident, not where you'd notice a trend.Agent health (Agents list badges, Agents → Statistics league, agent Statistics gauge, and overview timeline) aggregates recent rates into a transparent 0–100 health score, with rate-spike detection when a metric jumps vs baseline and score-drop alerts when the score itself falls versus seven days ago. This is the layer designed to notify you and to rank agents against each other — not only to chart each agent in isolation.
The relationship between these three: health alerts and analytics tell you something changed; logs tell you what specifically and why. A useful monitoring habit is starting from whichever surface first caught your attention (usually an alert or a dashboard trend) and drilling down into logs only once you know roughly what you're looking for. Starting cold in the raw logs without a hypothesis is a much slower way to find a problem.
2Prerequisites
- A playbook with some real traffic history. Monitoring concepts are much more concrete against actual data than a freshly published, untested graph
- Growth+ plan for full analytics and longer log retention (some monitoring views are plan-gated; check your plan on Workspace settings if a view seems limited)
- Familiarity with basic playbook structure (steps, routes) from the first-playbook tutorial
3Step-by-Step Setup
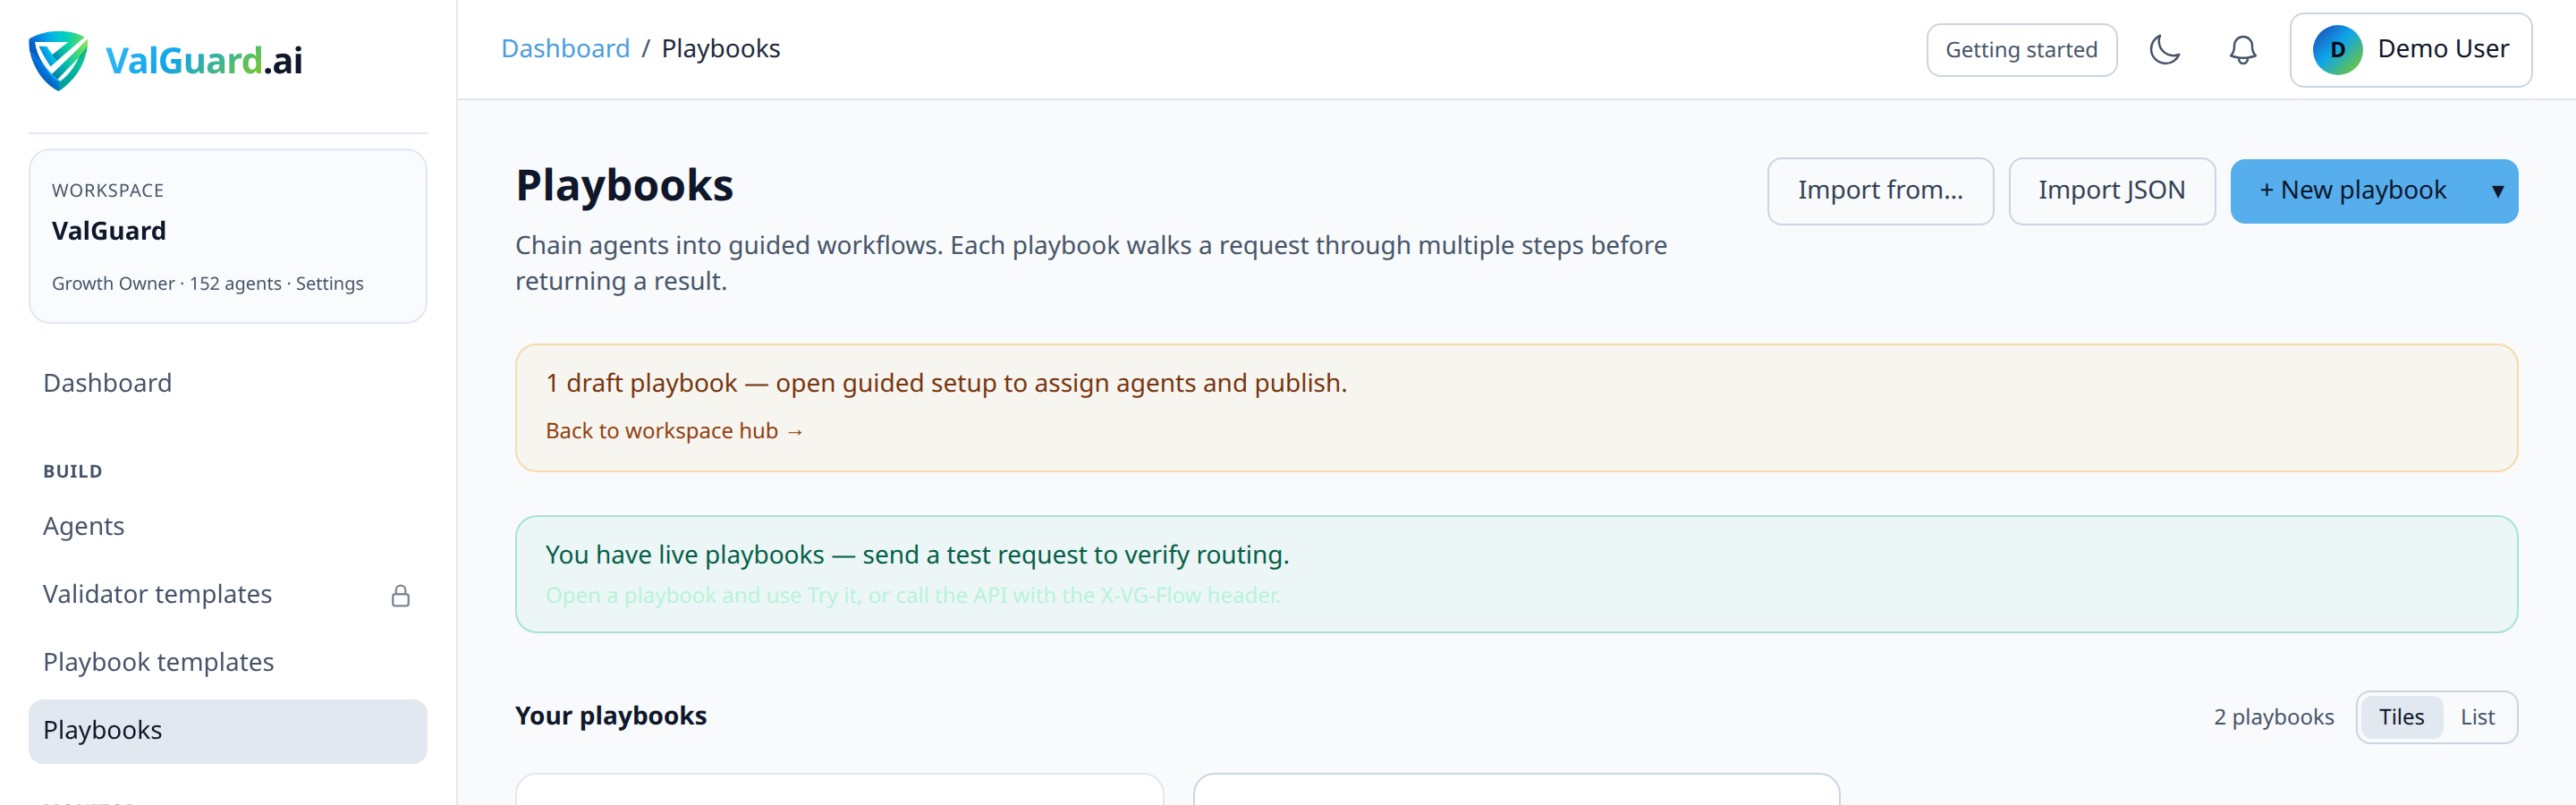
Step 1: Open the playbook analytics panel
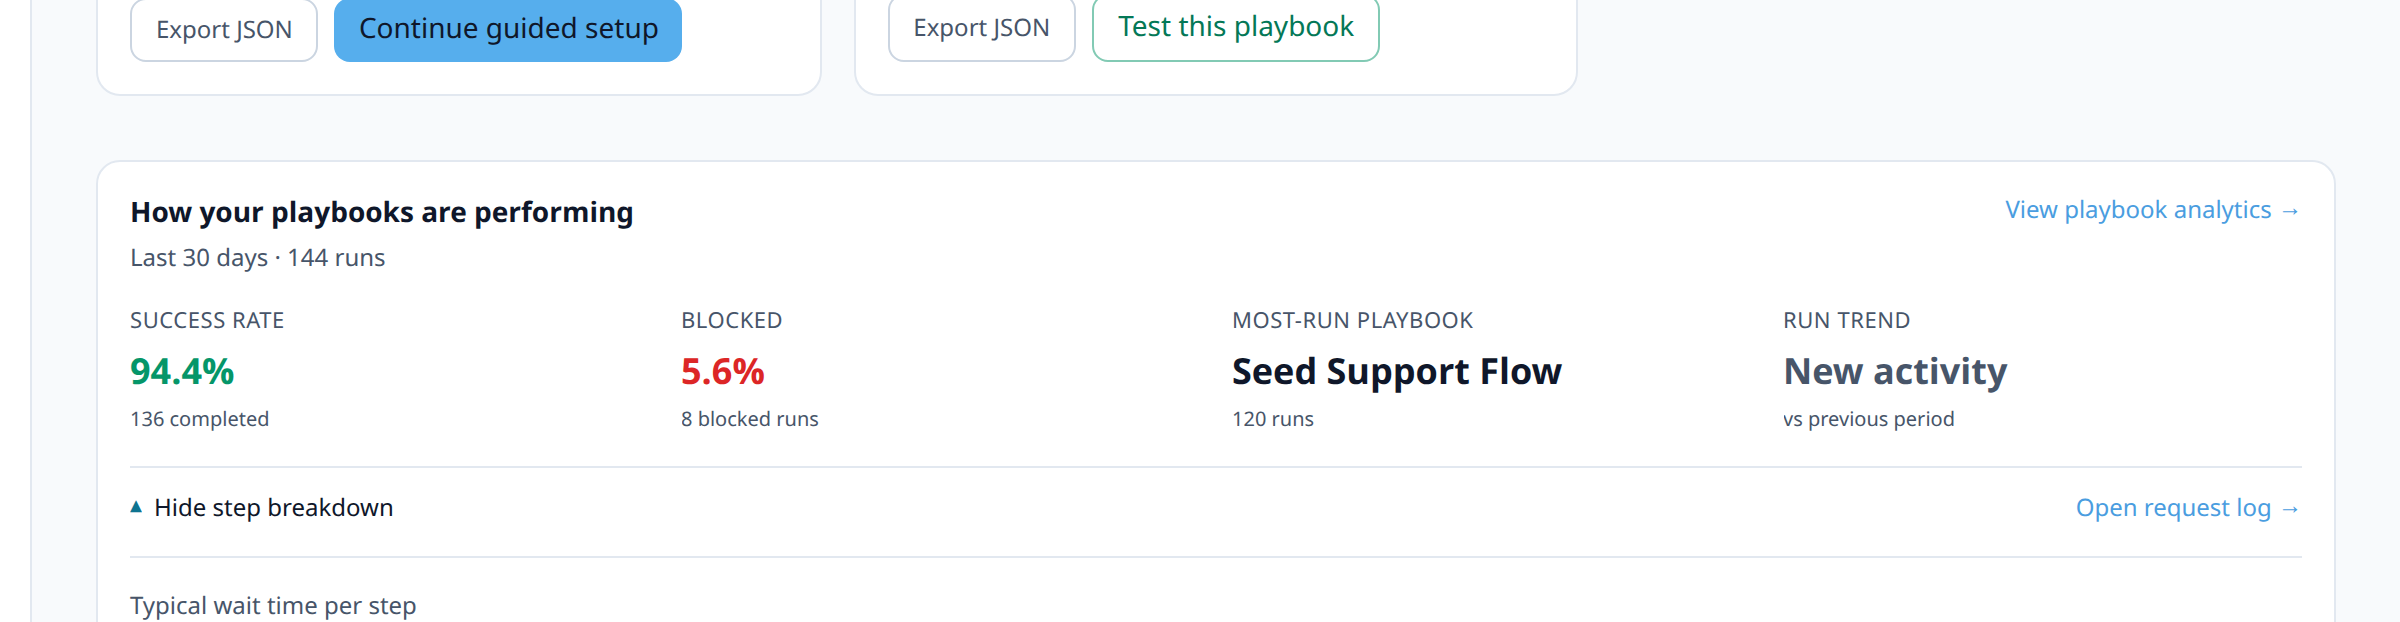
Go to Dashboard → Playbooks. The list page shows How your playbooks are performing (success rate, blocked runs, most-run playbook). Open the target playbook for per-flow detail, or use View playbook analytics.
Step 2: Review step-level latency
Drill into per-step latency to identify your playbook's actual bottleneck. The step with the highest median or tail latency is usually where optimization effort (a faster model, caching, or reconsidering whether it needs to be sequential at all) pays off most.
Step 3: Review branch frequency
Check how often each route is actually taken relative to what you expected when you designed the graph. A branch firing far more (or less) than anticipated is a signal worth investigating, whether that means the primary path needs improvement or a fallback path is undersized for its actual usage.

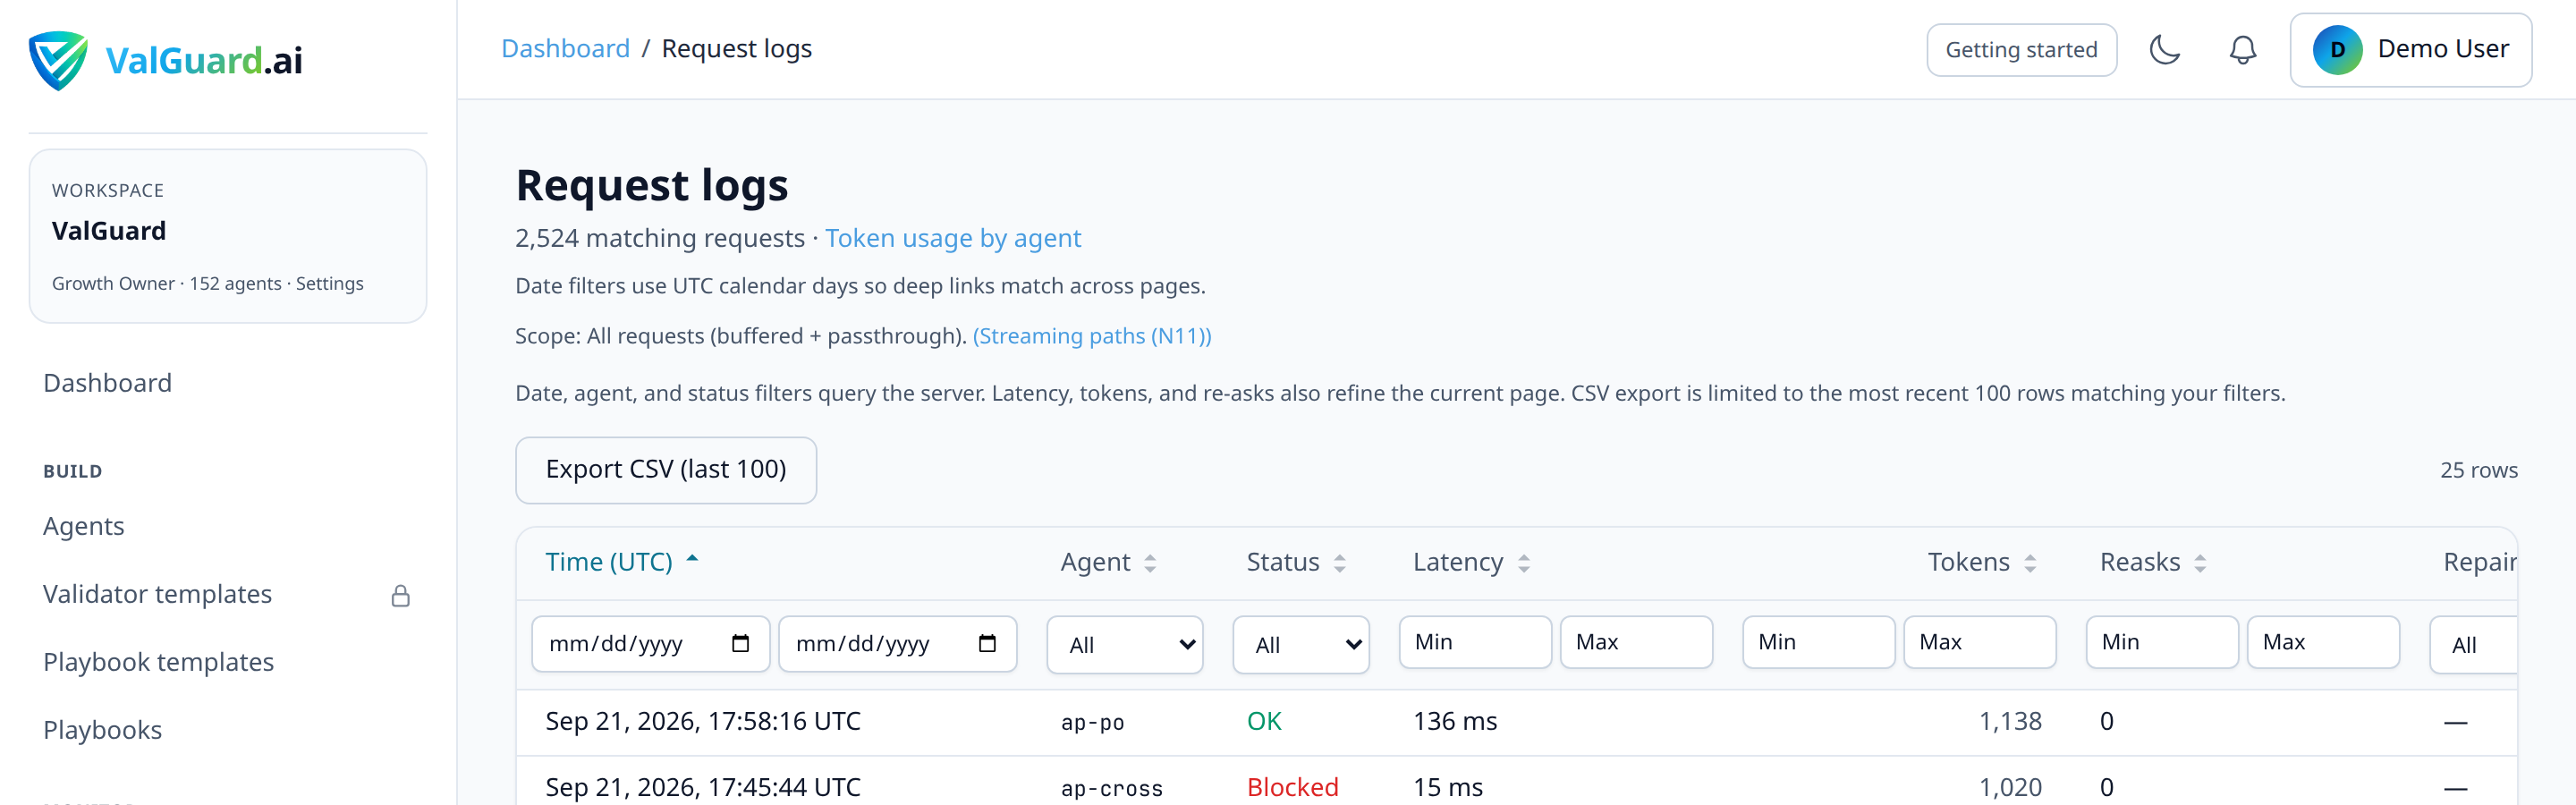
Step 4: Inspect request logs for a specific incident
If you're investigating a specific complaint or anomaly, go to Dashboard → Request logs, filter by time range and status, and find the specific request(s) involved.
Step 5: Cross-reference with validation logs
For any request that failed, Dashboard → Validation logs shows exactly which validator failed and why, filterable by
step_keyfor orchestration runs. This is where "the playbook blocked something" becomes "this specific rule, on this specific step, for this specific reason."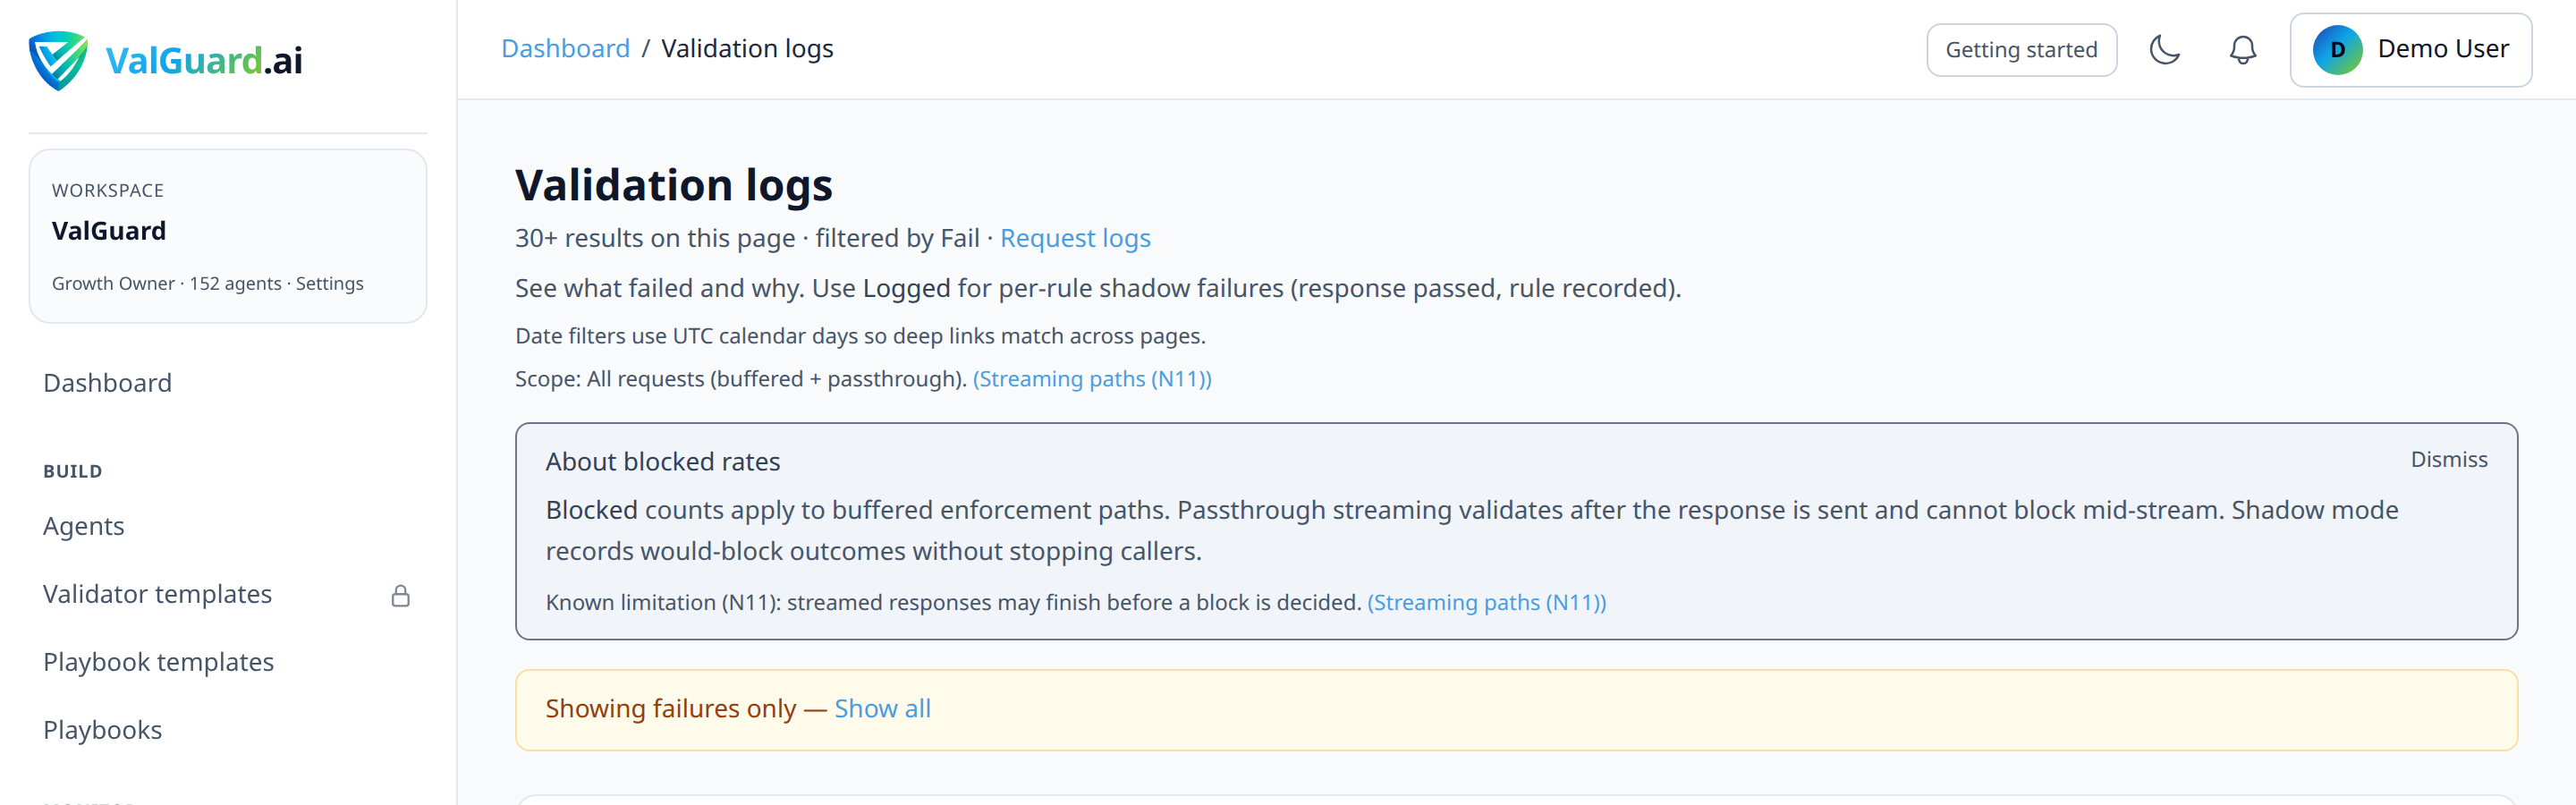
Step 6: Check the top failing validators view
The dashboard overview highlights top failing validators over a rolling window (commonly 30 days), a fast way to spot a validator that's disproportionately responsible for blocks or warnings across your whole organization, not just one playbook.
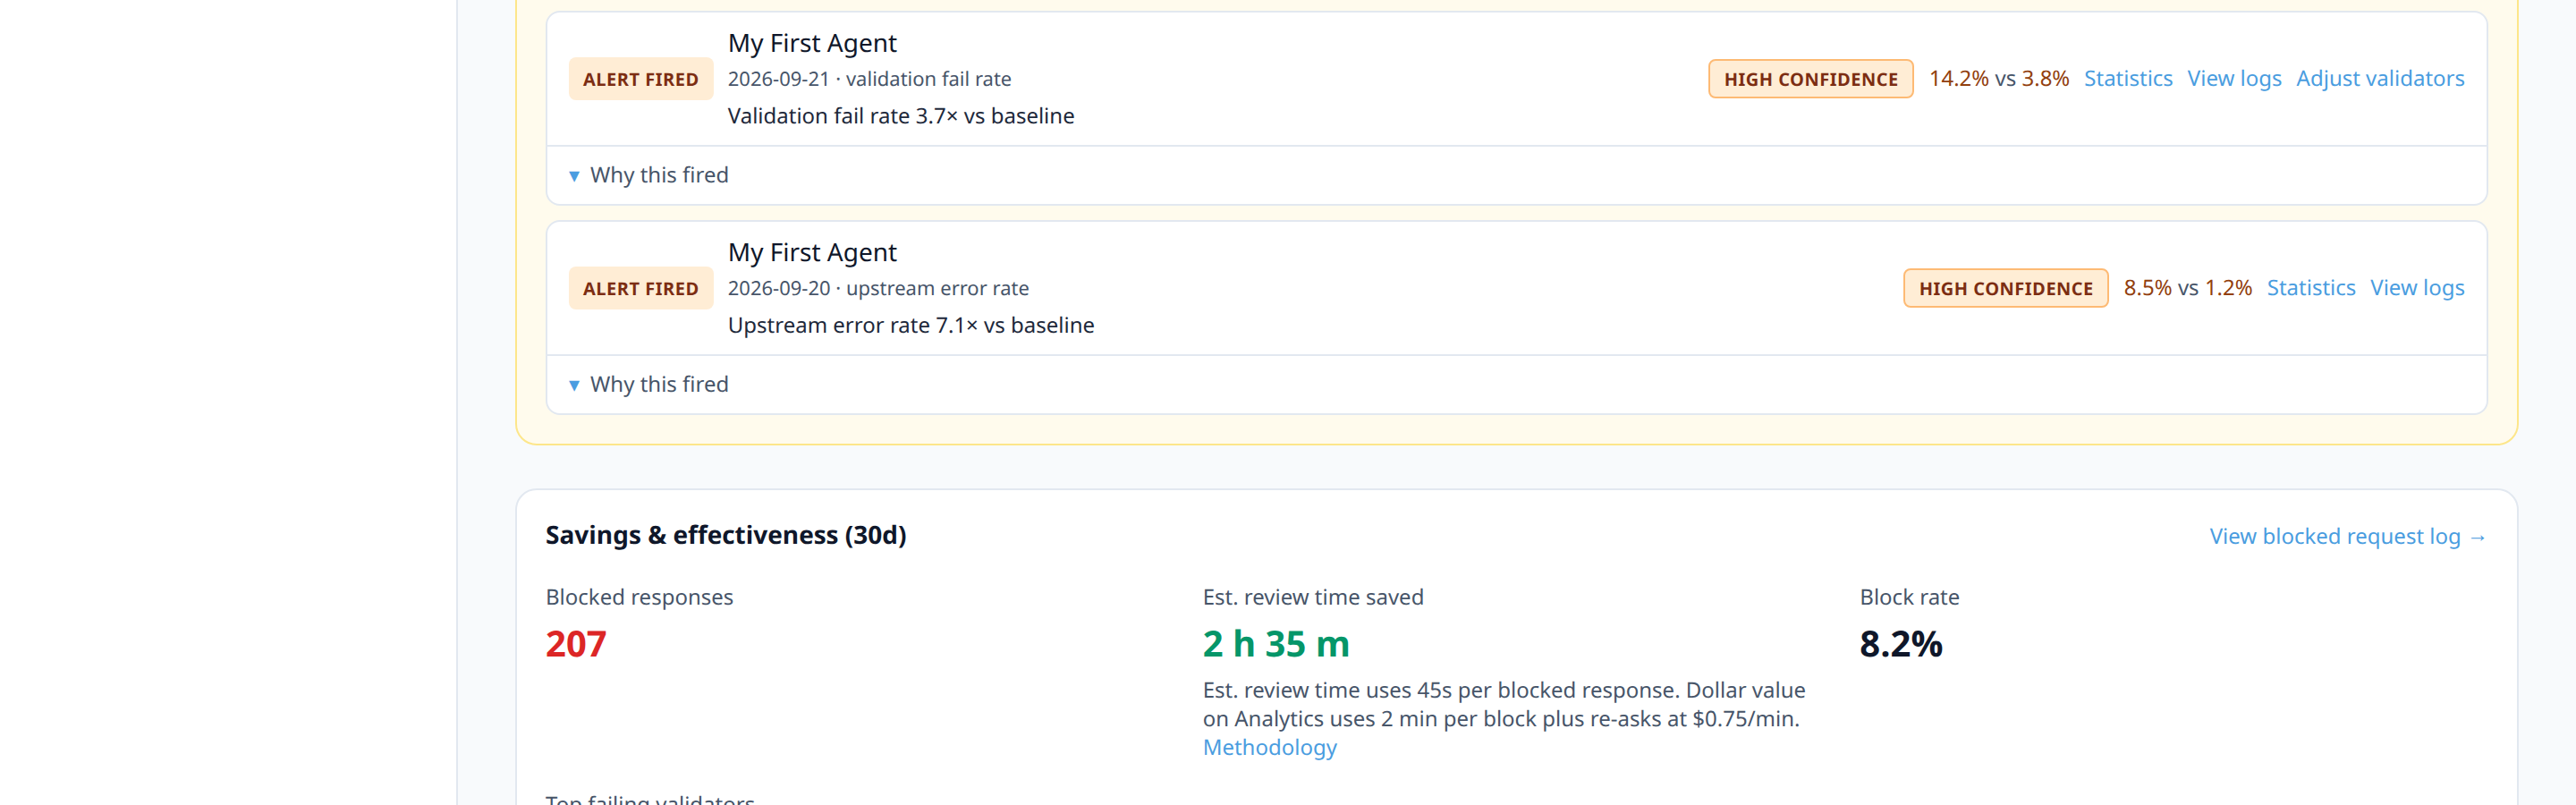
Step 7: Set up the agent health timeline
The overview's Agent health timeline merges spike alerts with at-risk scores, with direct log links to jump straight to the blocked requests or validation warnings behind a given alert.
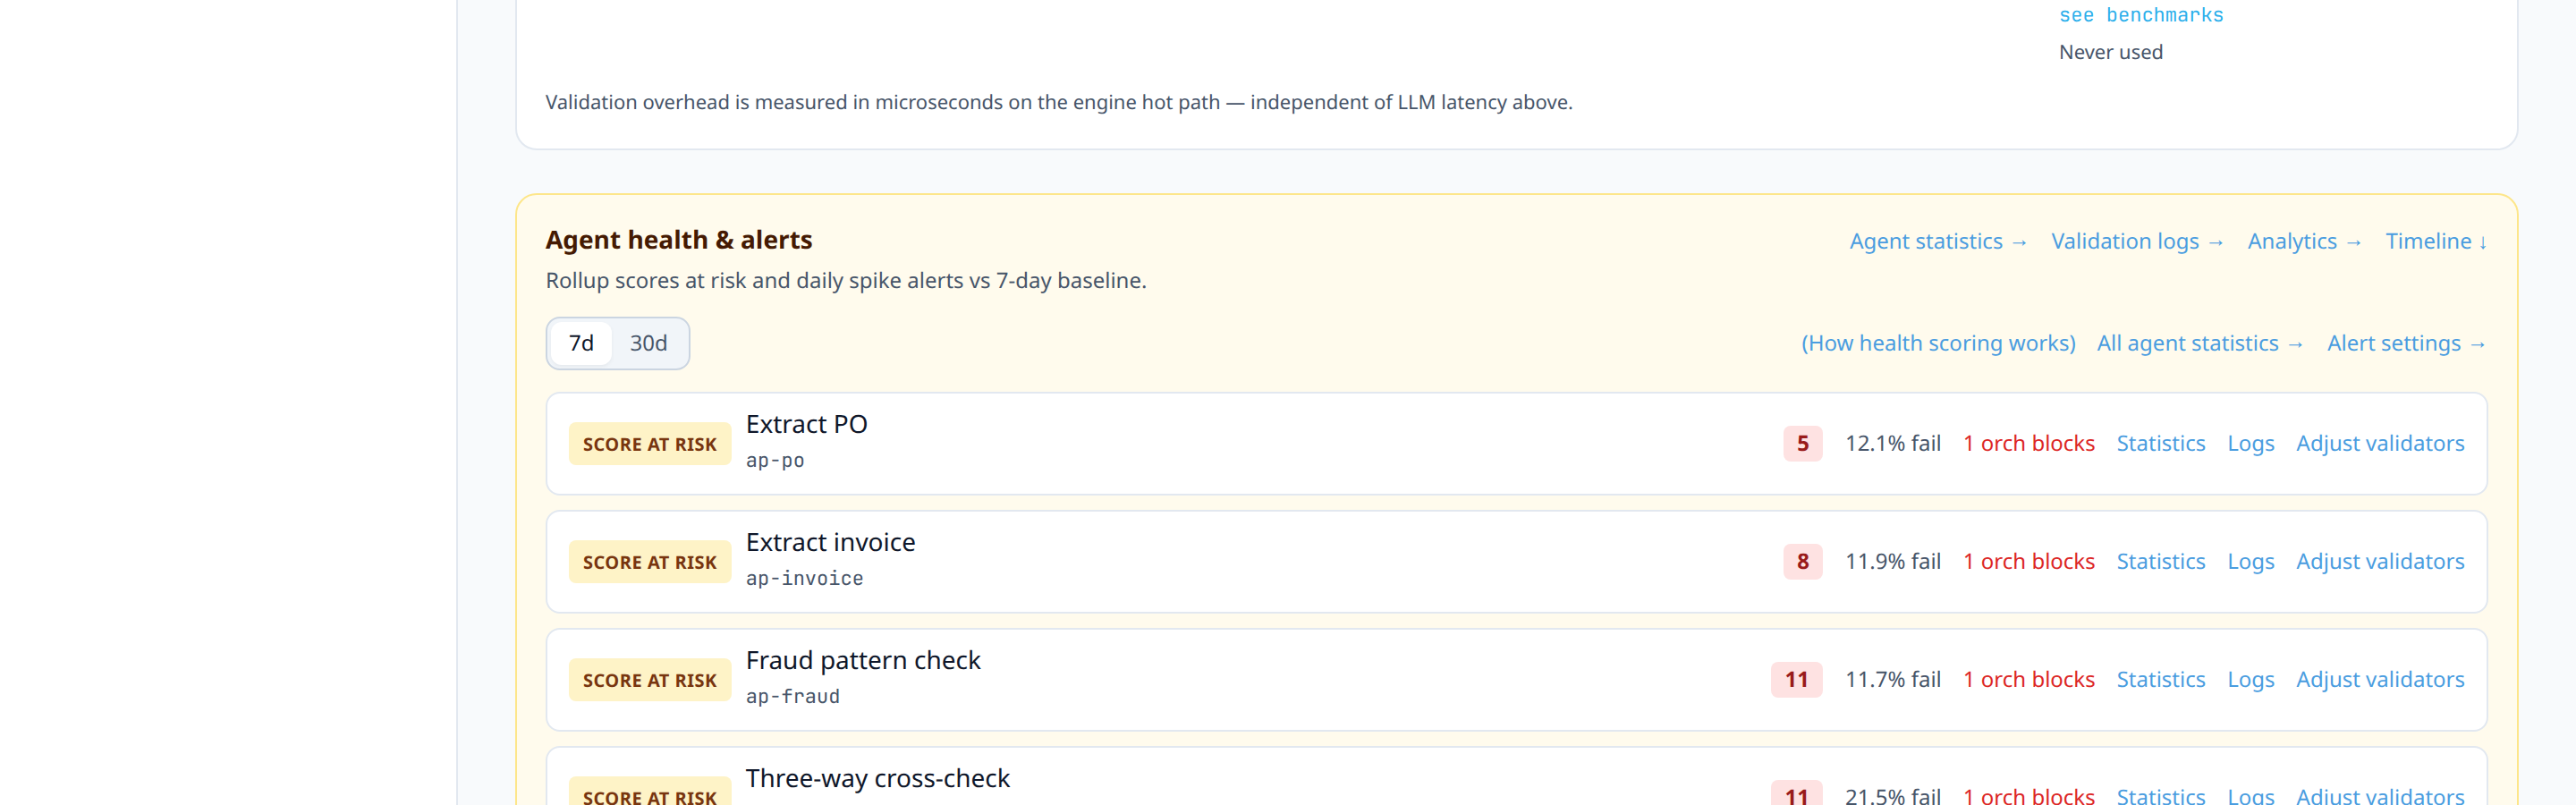
Step 8: Configure notifications so alerts reach you
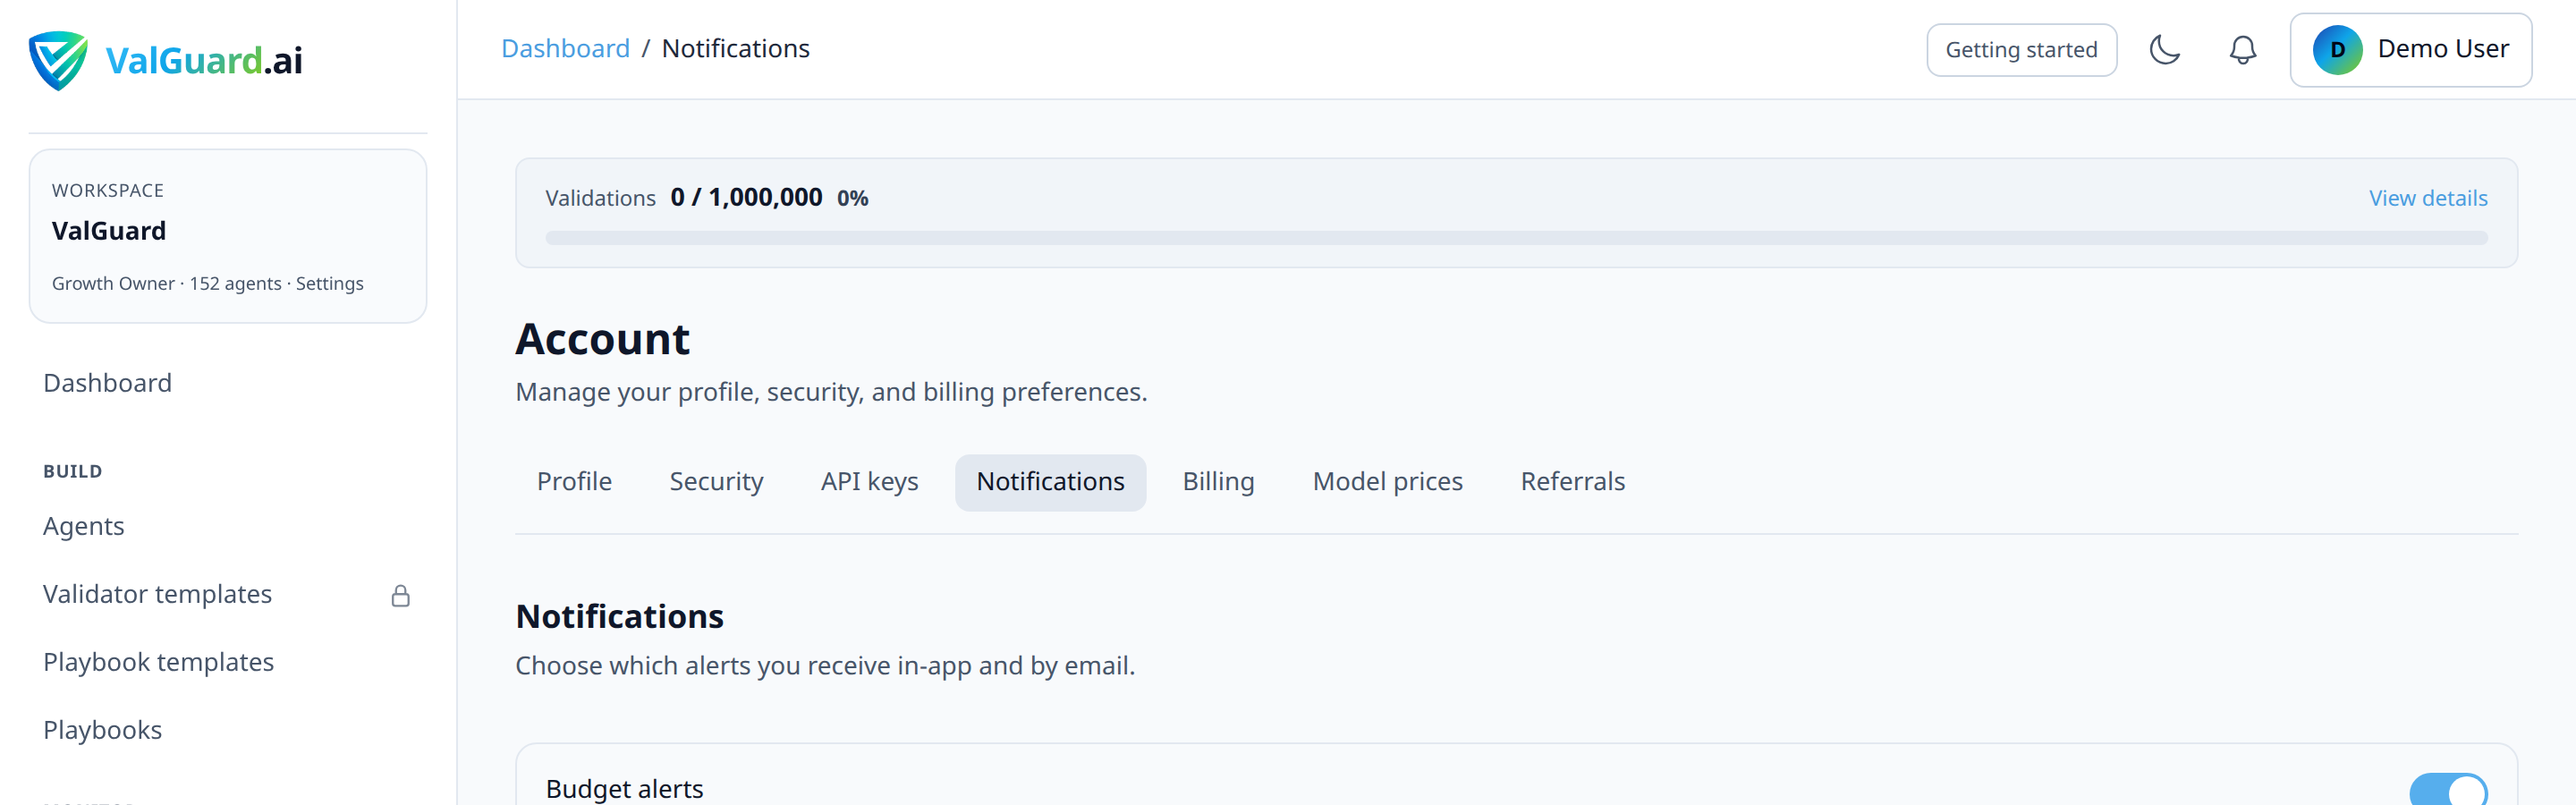
Go to Dashboard → Account → Notifications (billing notifications section) and enable health alerts: rate spikes (block / warn / fail / upstream) and score-drop (default 15 points vs 7d ago). Optionally enable the weekly health digest so Mondays deliver a league snapshot. Don't rely on remembering to check the dashboard regularly; let spikes and drops push a notification to you instead.
Step 9: Open the agent league (Statistics)
Go to Agents → Statistics. Confirm each agent has a rank, health score, Δ7d, and sparkline. Expand the formula drawer on a low-scoring agent — penalties should explain why the score is below 100. Use Download CSV when you want an offline weekly review (
GET /api/dashboard/agent-league?format=csv).Step 10: Establish what "healthy" looks like for this specific playbook
Every playbook's normal baseline is different. A KYC review playbook might reasonably have a 15% review-handoff rate, while a simple format-check playbook might expect under 1% blocks. Note your playbook's typical range after a few weeks of stable operation, so a future spike alert is meaningful relative to this playbook's baseline, not a generic threshold.
Step 11: Review trends on a schedule, not just when alerted
Spike alerts catch sudden changes well; slow drift (a validator's block rate creeping up 0.5% per week, or a score sliding a few points each day) is easier to catch with a periodic league review — or the Monday digest — than with alerting alone. See the health score pillar for the published formula. For a reusable Monday ritual, install the weekly agent league table playbook and paste the CSV or digest into the extract step.
4Diagram / Flow
5Configuration Examples
Orchestration analytics API (for building your own dashboards, if needed; session-authenticated, called from your logged-in browser or a server-side integration holding a valid session cookie, not the API's key auth):
curl -si "$APP_URL/api/orchestration/analytics?flow_id=$FLOW_ID&days=7" \
  -H "Cookie: $SESSION_COOKIE"
Actual response shape:
{
  "analytics": {
    "period_days": 7,
    "total_runs": 1204,
    "run_outcomes": { "completed": 1134, "blocked": 62, "failed": 8, "running": 0 },
    "success_rate": 94.2,
    "blocked_rate": 5.1,
    "top_flow": { "flow_id": "...", "flow_name": "KYC Document Review", "flow_slug": "kyc-document-review", "run_count": 1204 },
    "step_latency": [
      { "step_key": "extract_id", "step_label": "Extract ID", "run_count": 1204, "p50_ms": 620 },
      { "step_key": "cross_check", "step_label": "Cross Check", "run_count": 1204, "p50_ms": 410 }
    ],
    "branch_frequency": [
      { "condition_type": "on_validation_pass", "route_count": 1023 },
      { "condition_type": "on_validation_block", "route_count": 181 }
    ]
  }
}
Note
branch_frequencyis grouped bycondition_type(which route condition fired, aggregated across the whole flow), not by an individual edge's from/to step keys with a percentage. For a specific step's outcome breakdown, usestep_validation_statusandagent_slug_validationinstead, and compute your own percentages fromrun_count.6Testing and Verification
- Baseline capture. After a few weeks of stable operation, record your playbook's typical run count, success rate, and branch frequency somewhere your team can reference. This becomes the "normal" you compare future alerts against.
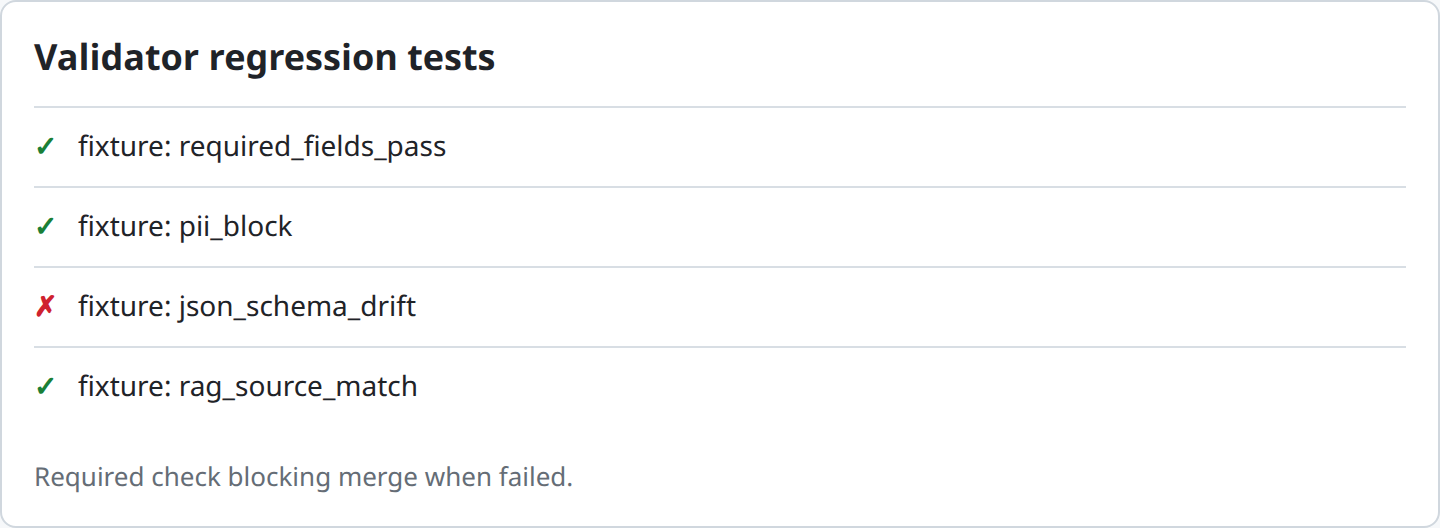
- Alert delivery check. Confirm health alerts actually reach your configured notification destination. Don't assume the toggle being on means delivery works until you've seen at least one real (or deliberately-triggered-on-a-test-agent) alert arrive.
- End-to-end diagnosis drill. Pick a real (or synthetic) past incident and practice the full path: alert or dashboard trend, to analytics, to logs, to specific requests, so the workflow is familiar before you need it under real pressure.
7Troubleshooting
"I don't see step-level analytics for my playbook." Confirm your plan tier includes analytics (Growth+ for most detailed views). Check Settings for your current plan, and consider whether an upgrade is warranted if step-level detail is important for your use case.
"Branch frequency numbers don't match what I remember configuring." Branch frequency reflects actual traffic, not your design intent. If it looks wrong, the question isn't whether the dashboard is broken, it's why real traffic is routing differently than expected, which usually points to the upstream agent's actual output distribution rather than the graph configuration.
"I got a spike alert but the dashboard looks normal now." Spike alerts are based on a rolling window at the time they fired. A transient spike (a brief upstream provider issue, a short burst of unusual traffic) can trigger an alert and then resolve on its own; check the request logs for the specific alert window to understand what happened even if current metrics look fine.
"Validation logs are retained for a shorter period than I need for investigating an older issue." Log retention varies by plan tier. Check Settings for your plan's retention window, and consider whether exporting logs periodically (via the audit export API, where available) fits your investigation needs for longer-term analysis.
"I'm getting too many health alerts and starting to ignore them." Revisit your playbook's actual baseline (Step 10). Alerts tuned against a generic threshold rather than this specific playbook's normal range will fire more often than they're useful; if your baseline block rate is genuinely 10%, an alert threshold set for a typical playbook's 2% baseline will constantly false-positive. For score-drop noise, raise
health_score_drop_pointsor confirmhealth_alert_min_volumeso low-traffic agents do not page you.8Best Practices
- Establish a per-playbook baseline, not a generic expectation. "Normal" varies enormously between playbook types, and alerting is only useful relative to a playbook's own typical range.
- Start diagnosis from whichever signal caught your attention, and drill down, rather than starting cold in raw logs without a hypothesis.
- Review trends on a schedule, not just reactively to alerts. Slow drift is a real failure mode that spike-based alerting won't catch on its own.
- Configure notifications rather than relying on memory to check dashboards. The whole value of alerting is not needing to remember.
- Practice the diagnosis workflow before you need it under pressure. A familiar path from alert to root cause is faster when it matters than improvising one during an actual incident.
9Advanced Options
Building custom dashboards from the analytics API. For teams with existing internal observability tooling, pulling orchestration analytics and validation log data via API into your own dashboards (alongside other application metrics) can give a more unified view than switching between ValGuard's dashboard and your own tools.
Correlating orchestration metrics with cost data. Step latency and branch frequency trends often correlate with cost trends (a branch that fires more often, if it routes to a more expensive model or triggers more reasks, directly affects spend). Worth reviewing analytics and budget/token dashboards together rather than in isolation.
Webhook-driven external alerting. Beyond ValGuard's own notification system,
orchestration.step_completedwebhooks (see the validation webhooks tutorial) let you build near-real-time external dashboards or alerting pipelines reflecting playbook execution as it happens, rather than relying solely on ValGuard's own periodic health-check cadence.10Summary and Next Steps
Monitoring a playbook well means knowing which of the three observability surfaces (aggregate analytics, specific logs, and health alerts) answers the question you actually have, and using them in that order: let a trend or alert tell you something changed, then drill into logs to find out what and why. The technical mechanics are straightforward; the skill is in establishing what "normal" looks like for each specific playbook and reviewing trends on a schedule rather than only when something alerts you.
From here, using budget alerts, using Cost control, and setting monthly token limits cover the cost-specific monitoring dimensions that pair naturally with the operational monitoring covered here, and configuring validation webhooks is worth revisiting for pushing real-time orchestration events into your own external tooling.